


All You Need to Know About Making a Monthly Sales Report
Posted on October 4, 2022 by Shagun Sharma
Do you know that 57% of small business owners rely on personal savings as their top source of capital when starting a business? This is why they are always monitoring their past performance and ensuring that the gaps are covered in their future moves.
But still, a large percentage of growing business owners are still wondering where they are lacking in monitoring and upgrading their teams’ performance to generate better sales. Well, that’s probably the difference between a successful business and a struggling business. While ensuring that you make great plans for your business, you must also make sure that your plans are being executed properly.
The problem with some businesses is that they are not monitoring the performance of their teams and thus, not getting the desired outcomes. 61% of sales professionals think that selling is harder nowadays than it was five years ago.
Today the need for monthly, weekly, and daily sales reports is more than ever, and you need to capitalize on it to make your business a success. Managers and sales representatives utilize modern sales analysis reports to optimize performance and ensure healthy business growth. With the rise of current sales reporting software, reporting has become relatively easier.
Thanks to the growth of interactive reports, you can generate sales reports that are easier to comprehend within a few clicks.
Some businesses find making manual monthly reports a challenging endeavor. They perform manual accounting, fill the data into templates, and then manually create graphs and pie charts for better data visualization. However, visualizing each spreadsheet can be a complete hassle and time-consuming.
With auto-generated reports and forecasts to help you set goals, Kylas has all you need in software for your data reporting. With interactive reports, you can customize data according to the person it is shown to. On the other hand, forecasting makes it easier to comprehend how a single change in factors can impact sales too. Additionally, 22% of sales professionals who leverage a CRM identified “offering detailed analytics and reports” as being one of a CRM’s biggest benefits.
This blog post will define daily, weekly, and monthly sales reports, along with examples so you can use them to analyze sales data. Additionally, we will also go over the purpose, the creation process, and how to report sales so that you know what goes into each report and can use them as inspiration.
With Kylas, get actionable insights at the click of a button. Make data-driven decisions for your business, and deep dive into auto-generated reports to aid your set business goals.
What Is a Sales Report?

In a business, a sales report provides insight into different sales activities and their performance. Regulatory audits provide a snapshot of the company’s exercise at a particular point in time, allowing the company to assess the situation and determine what actions need to be taken.
There are many formats for daily sales reports, including KPIs such as how many phone calls a rep made, meetings scheduled, or how many leads were created on any given day. Sales dashboards enable automating calculations, allowing you to focus your efforts on human-centric tasks rather than tedious manual calculations.
For instance – You run your insurance company, assign sales calls to your sales representatives, and get daily leads. If you don’t create a sales report, you will find it difficult to track how many calls each sales representative made, how many leads were generated, and how many sales were converted. Hence, this leads to inefficiency as your business has no track of the amount made per sales executive.
With a sales report, you can assess your company’s situation better as you can now track the calls made, leads generated, and sales converted. This undeniably helps weed out inefficient sales executives and provides a snapshot of the company’s performance.
Now with a deeper understanding of sales reports, let us have a detailed look at the types of sales reports.
Types of Sales Reports

A sales report does not have to be precisely the same for every organization, and there is no one-size-fits-all format. Thus, a diverse range of data can be displayed in different sales reports in a single organization.
A description of the types and uses of sales reports is provided below.
1. Sales Pipeline Report
Your sales pipeline report shows you how much value your pipeline has and how many deals are at each pipeline stage. In addition, it illustrates which deals the company would lose, which it would win, and how this might affect the overall revenue.
For instance: You have 4 potential clients to sell your services to. A sales pipeline report can easily ensure which clients will convert and which will not. You can create a baseline scenario and track the progress of your sales efforts and the overall impact these clients will have. So, if 2 clients convert, it will lead to X revenue. Additionally, if 4 clients convert, it will lead to Y revenue, etc.
2. Conversion Rate Report
Your sales team’s conversion rate measures how effectively new leads are converted into customers.
Additionally, this valuable data highlights the performance of sales reps and sales teams. When leads do not become deals and new clients, conversion rate reports can help you identify improvements.
For instance- You have 5 sales agents in a team, and with a conversion rate report, you can effectively monitor how each one is performing. You can easily identify how many calls were made, leads were generated, and sales were made. This will help you measure the performance of your sales team.
3. Customer Churn Report
Customer churn rate measures the percentage of customers who stop using your product or doing business with your company. It is crucial to think about the churn rate because it tells you if you are targeting the right prospects or not.
This is an essential report to create for companies that offer product trials. This helps the company visualize how many people left after the trial without making a purchase.
4. Sales Forecast Report
The sales forecast estimates how much a company, sales team, or salesperson will sell weekly, monthly, quarterly, and yearly.
When you create a sales forecast, you can spot potential problems early on, so you can avoid or solve them before they become a problem.
For instance: Your team makes 5 sales per day. It is essential to create a forecast that you will be making 35 sales per week and 150 sales per month. Using this data, you can check if it is profitable for you and build upon strategies to improve on the data.
5. Sales Call Report
Measure how many sales calls your reps make to their prospects to assess their effectiveness. As a result of the sales call report, you can also isolate specific metrics and segments regarding each prospect contacted.
As crucial as learning about the different sales reports, it is equally vital to know the KPIs needed to judge your sales records effectively. In the next section, we will look at some critical KPIs to help you evaluate your reports seriously.
Essential KPIs for Sales Reporting
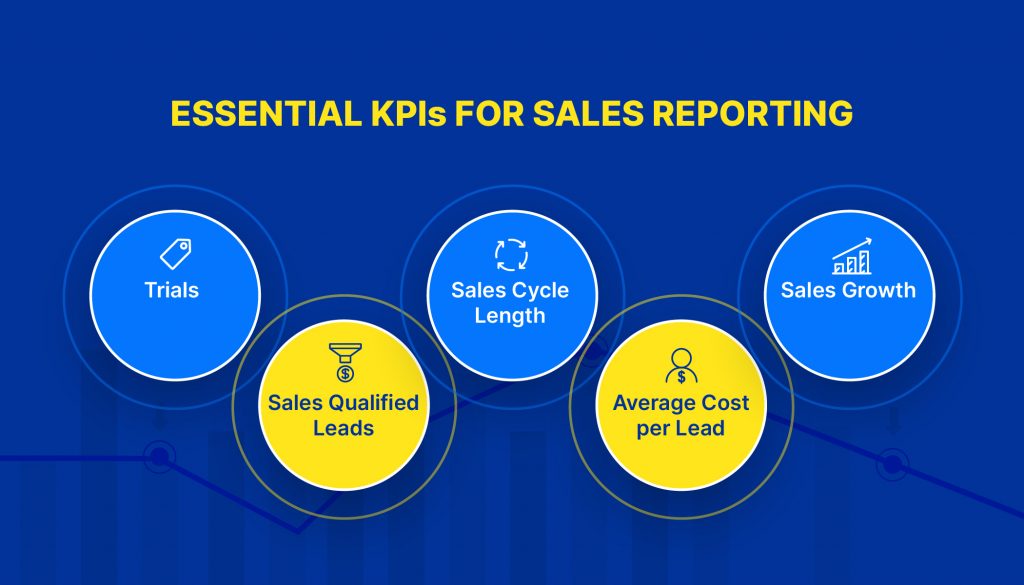
Key performance indicators (KPIs) or sales effectiveness metrics track the effectiveness of sales activities within a company and motivate modern sales teams.
Choosing KPIs will depend on the business model and goals of your organization. You should include the following sales KPIs in your sales report.
1. Trials
SaaS models, particularly, use trials as a KPI. This metric tracks how many new accounts are opened during a given period. Leads generated from marketing can be qualified and closed by sales if those leads are large enough.
2. Sales Qualified Leads
Market-qualified leads become SQLs before they become marketing-qualified leads. After the sales team meets certain conditions, they become SQLs. A lead is someone who intends to buy.
3. Sales Cycle Length
Generally, it takes this long to close the deal after meeting a prospect for the first time. Your sales process efficiency can be measured by how quickly leads become customers based on this KPI.
4. Average Cost per Lead
Simply put, this KPI measures the company’s cost of generating a lead. Customer acquisition costs are directly related to this metric. A cost-per-lead KPI is most accurate when it considers all marketing expenses in gaining potential customers.
5. Sales Growth
A KPI that tracks sales growth and your company’s growth is called a KPI of sales growth. This can also help you determine the growth rate of your company.
How to Make Sales Reporting Effective?
After learning the KPIs, the key lies in how you can improve your sales reporting and make sure that the goals of the company and the team’s performance are in sync with each other. Let us find out.
To ensure your sales report is adequate, consider the following:
- It would be best if you had a clear goal to collect and analyze the appropriate data.
- Highlight the most critical points of the sales report in the sales report according to who will read it. Identifying which marketing campaigns impact sales most profitably would be helpful to a marketing manager.
- Integrate data based on goals. You must measure a team’s performance, new business opportunities, and regional sales.
- Analyze your data visually by presenting it in graphs and charts.
- For sales reports without a set format, use templates you can customize.
How to Make a Sales Report?

The real challenge in a report lies in delivering sales reports that convey the correct data about the sales process in a way that intrigues the audience. Here are five successful steps to create an interesting sales report.
1. Make Sure Your Sales Report Has a Purpose
Rather than looking for data that can be used for individual goals, look for data that can be used to achieve specific objectives. When assembling a sales report, ask yourself why you’re doing it.
How do you measure the success of your promotional campaigns? Looking for sales trends to use in a sales forecast? Do you have a sales report that inspires your team to work harder? Does your sales operations team find it helpful to have a data snapshot?
Gathering and analyzing the right kind of data is the purpose of your sales report. A time period will be included in the report, as well as the scope of the report.
2. Consider Your Audience When Writing Sales Reports
Your sales report should focus on the information your audience cares about once you know why you’re creating it. A CEO and a marketing director wouldn’t receive the same cold email, would they?
A sales report sent to both shouldn’t be the same. In the case of a marketing head, they may be interested in details like which marketing campaigns resulted in the highest sales volume.
3. Take a Look at Your Sales Data
Following the outline of your sales report’s purpose and audience, you’ll gather and filter sales data and analyze the results. Maintain a stress-free and goal-driven data collection process.
The data can be easily pulled with tools that integrate with CRMs such as Kylas and other sales software. Begin by defining what metrics you will include in your report and which trends you think are essential.
4. Engage Your Customers With Engaging Visuals That Highlight Vital Sales Metrics
As important as the data itself is, how you present it is also important. The visualization of data can be helpful in this situation.
Utilize graphs and charts to clearly illustrate the impact of essential data, rather than expecting managers to read spreadsheets full of numbers.
5. Describe the Meaning of the Sales Numbers
It is possible to make erroneous judgments based solely on numbers. Rather than just giving over a bunch of numbers, you should always contextualize the data you present.
Creating a Monthly Sales Report
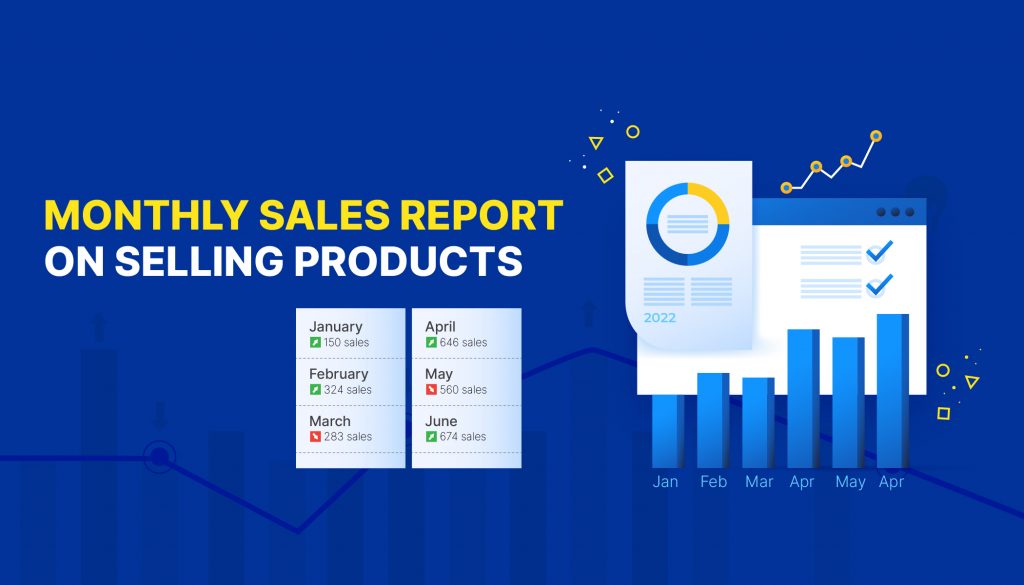
The following examples of monthly sales reports will also help you better understand the concept. Although it may be too long for you to implement corrections to avoid missing out on opportunities before it is too late, a month will give you a broader sense of how your sales reps are performing in the long run.
1. Sales KPI Report
Taking a look at a sales report example will help us understand how high-level metrics can be used to help executives make their lives easier.
A company’s sales strategy can be changed by tracking monthly metrics. At the same time, sales vice presidents, managers, and executives should monitor the most critical strategic and operational data to increase sales quality and performance.
2. Sales Opportunity Report
Management, development, monitoring, and analysis of opportunities should be included in a sales report template for sales executives. Leads within the sales funnel that are at the top of the funnel should receive special attention and care.
Simultaneously, data can be viewed in real time using professional BI reporting tools without manually optimizing numerous spreadsheets and static reports.
3. Sales Cycle Length Report
Your reps’ sales funnel’s sales report covers the beginning with the opportunity and ending with a closed deal. So, every rep’s performance is outlined, along with how long it takes them to close deals and how well they respond appropriately to each individual’s strengths and weaknesses.
4. Sales Conversion Report
The Sales Conversion report should show how your reps convert leads into sealed deals. Therefore, to increase sales conversions, you can identify where issues might arise and address them by analyzing each stage of this funnel.
Building reports in sheets is a strenuous task indeed. Filling data in spreadsheets with templates, analyzing the data, and coming up with charts can be a daunting task for companies. Additionally, they have to hire specialized people to work on the same, leading to extra costs.
Creating monthly sales reports is a crucial part of a business, but let’s make it easier with CRM Software by Kylas. With Kylas, track your sales and build interactive reports segregated for your reader base. Showcase the charts meant for overall growth. Additionally, customize and download according to your requirements with a single click. What more? Forecast your revenue as we advance effectively too.
Wrapping Up
It is worth mentioning that creating a sales report is the most crucial step in analyzing your business performance. But those spreadsheets don’t work anymore. They take up your time and cost your business a lot in the long run. You need a CRM that would do the job for you. After all, CRMs can boost sales by 29% and productivity by 34%.
With a CRM like Kylas, it is easy to create visual reports within minutes and forecast your business strength in the long run.
FAQs
Q1. What is the structure of the sales report?
Ans. Key performance indicators such as company performance, goods sold, and profits comprise an average sales report. It may also be worthwhile to consider metrics such as new opportunities, regional sales, team performance, sales growth, or other relevant data.
Q2. What is the purpose of a monthly sales report?
Ans. In a monthly sales report, sales are monitored, evaluated, analyzed, and trends are determined. It measures longer-term KPIs, such as sales cycle duration, conversion report, and month-end performance.
Q3. What is a monthly report sample?
Ans. Every workplace needs a sample of a monthly report regularly. We monitor each calendar month to ensure that various initiatives and tasks are effective, accountable, and transparent. Reports drawn from several months are compiled into an executive report.