


Ready to close more deals?
Join 13,000+ Indian businesses already growing with Kylas

Customize & automate to track leads & deals

Stay aligned as a team from first pitch to final win

Dynamic dashboards for leads, deals, emails, tasks & goals

Clean data, secure access, & smarter decisions for your team

Let AI handle the busywork, you focus on closing

350+ intelligent marketplace apps to grow your business

Control team & access without slowing the sales engine

Auto-track field sales activity with real-time visibility

Access AI-assisted insights & sales assistance

Route every lead intelligently, & never miss a conversion

Make calls directly with real-time logging & activity tracking

Prioritise intelligently, move stages autonomously, & win faster

Manage customers with a complete view of every touchpoint

Sell on the move with real-time access on Android & iOS

Generate, send and track quotes quickly with smart deal data

Stronger prospect connections with inbuilt WhatsApp

Track all customer conversations in one unified hub
Existing user? Login here.
By clicking on "Submit", you agree to our terms and you acknowledge having read our privacy policyI authorize Kylas Technologies Pvt. Ltd. & its representatives to contact me with updates and notifications via Email/SMS/WhatsApp/Call. This will override DND/NDNC.
Thank you for your interest in Kylas. Our experts will connect with you shortly.

4.7/5 rating on G2 and 4.8/5 Capterra
Native Agentic AI

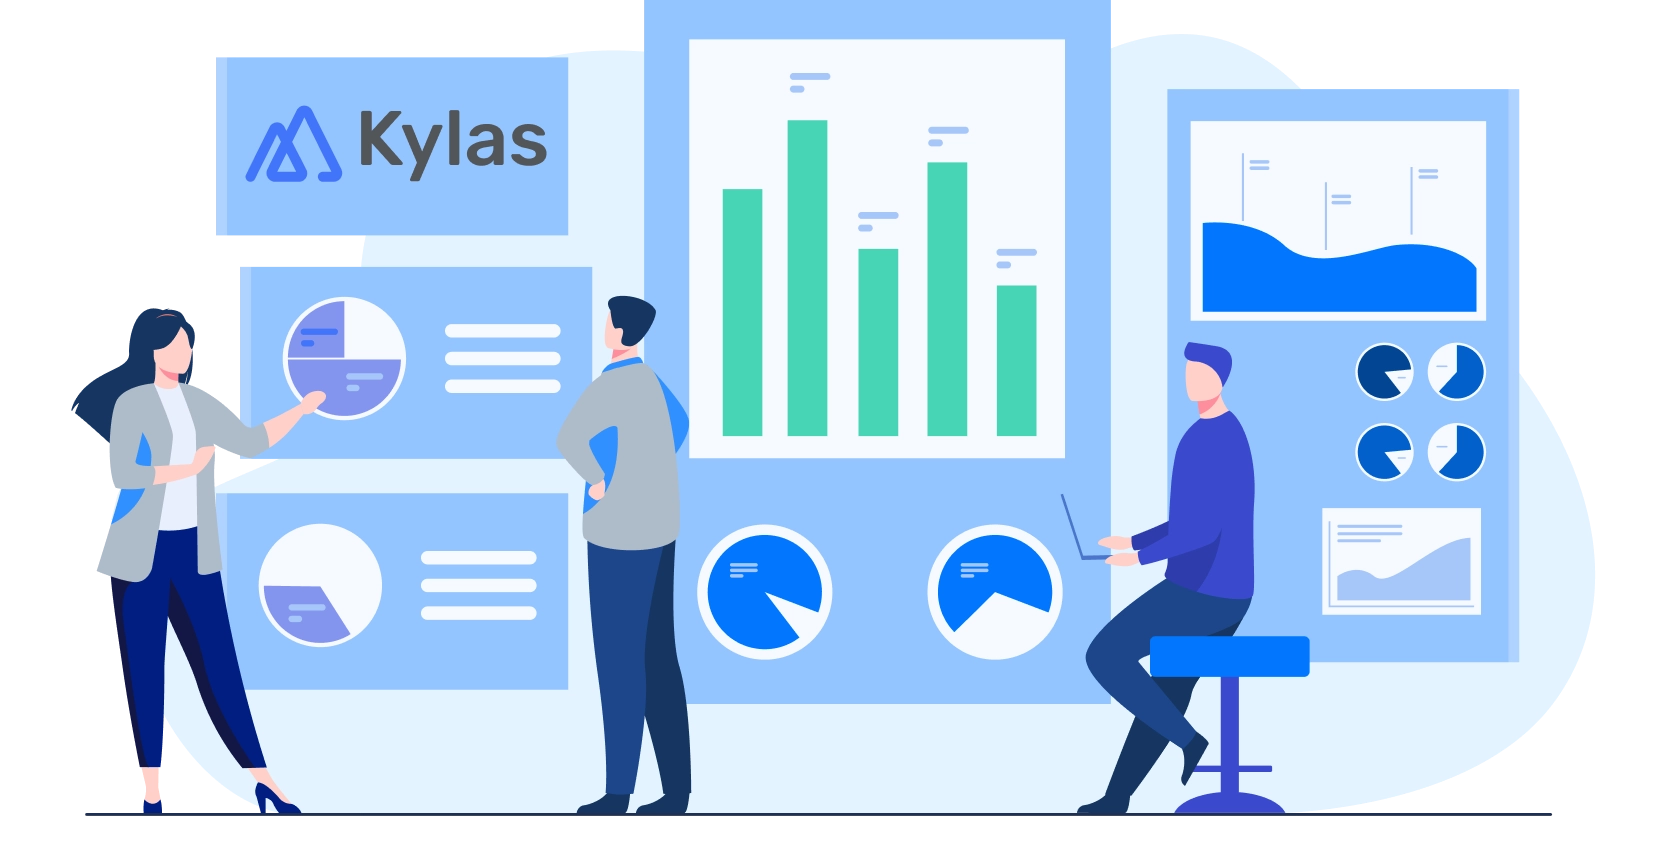
It’s time to do away with spreadsheets as Kylas brings visual & interactive reports to you. Deep dive into custom sales reports with one click access to actionable data.


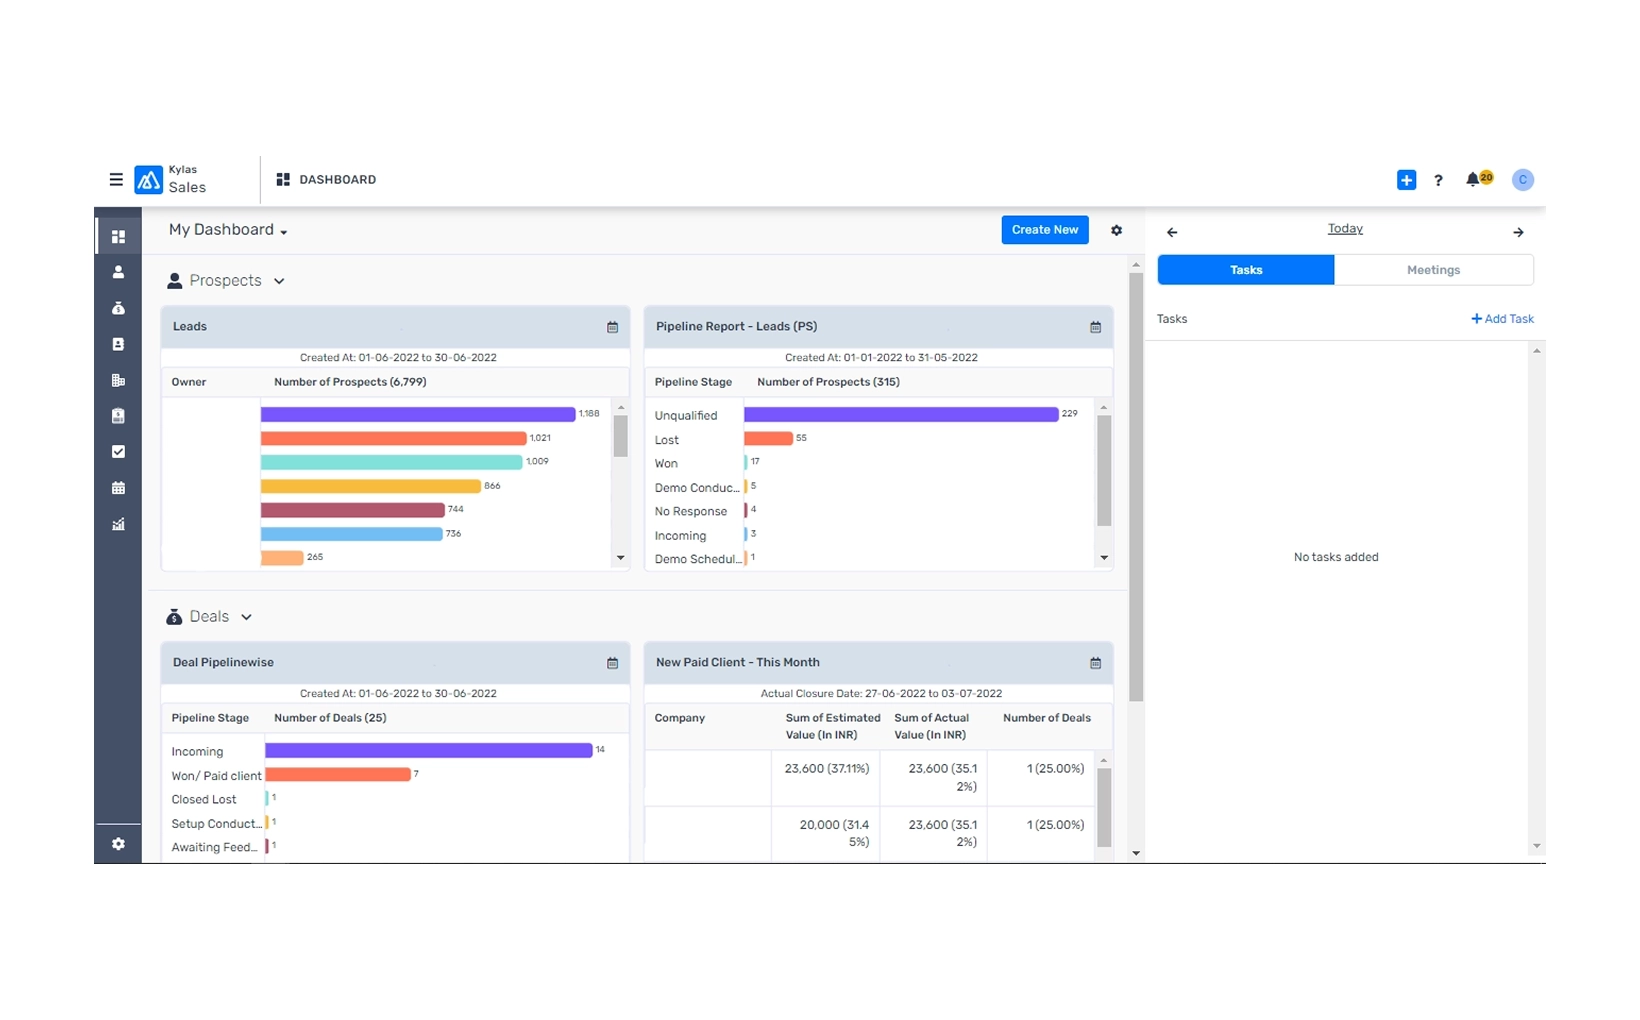
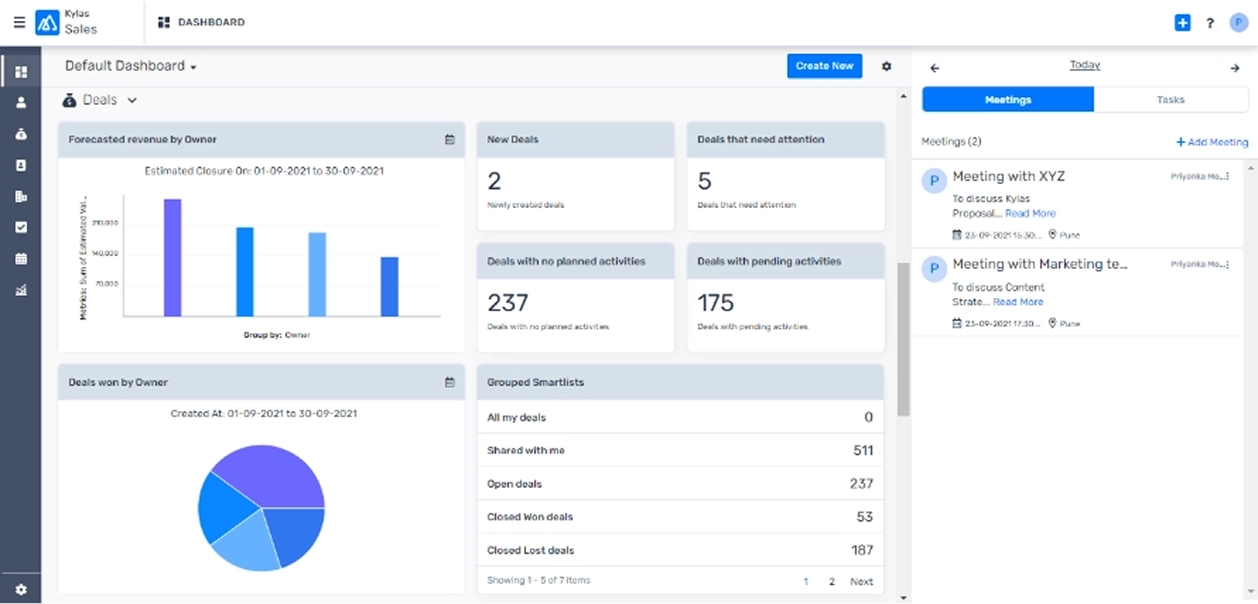
Sales Dashboard

Team Management

Revenue Forecast

Leads Reporting

Generate clean and precise reports with Kylas.Fill in the required information, set dimensions and metrics, and build your sales report from scratch.

Seamlessly export all your reports from Kylas.Share them with other team members and external stakeholders.

Customize existing reports basis dimensions,filters, and metrics to focus on the information that matters. Also view your report as a table, pie-chart and bar graph with a click of a button.

Get the right report without sifting through data.Use view filters (prospects, deal, tasks, company, dates and call logs) to quickly find thereports you need.Also track your sales reports by day, week or month to compare it with previous time periods.
Get real-time picture of your business’ productivity and sales progression with our sales Dashboard. Customize the dashboard with important metrics and reports as per your growing business’s requirement.
Get a clear picture of how much sales revenue your team can generate within a given time period and make the right business decisions- priortizing deals and allocating resources for higher conversions. With Kylas CRM you can forecast revenue basis the expected closure date of the deal.
Gain useful insights on your team’s performance right from the sales dashboard. Identify the top performing sales members and reward
them; invest in training those members who are not able to perform well.
A report is a detailed account of consolidated data that helps you draw inferences for informed decision-making.
A dashboard gives a summary of key metrics and other relevant data on a single screen.
Sales and support insights comprise all analytics that analyzes data about customers and internal teams to present in facilitating and streamlining better business decisions.
CRMs such as Kylas offer businesses tools to create and modify customizable sales reports according to their specific needs and criteria. In general, these reports contain data related to sales performance, pipeline status, lead conversion rates, and revenue forecasts.
Customizable sales reports provide sales teams and managers with the precise information they need to make informed decisions. These reports also help track the information of every sales rep, team, and the overall organization. Such sales reports also help forecast sales based on past and current sales data to predict future trends.
Customizable sales reports can provide insights related to total sales revenue, number of deals closed, average deal size, sales growth over time, sales by product or service category, number of leads at each stage of the pipeline, lead conversion rates, sales team performance, customer insights, and a lot more.
In Kylas, to create a tailored sales report, you need to fill in some fields as per your business, such as Report Name, Report Type, Entity Type, Chart Type, Date Filter, Date Range, Start Date and Time, End Date and Time, Dimensions, Metrics, and Filters. Once you have filled in all this information, you can create the required report.
Join 13,000+ Indian businesses already growing with Kylas